Katalyst Solutions - Web Design & Web Development serving Sterling, VA & Loudoun County & Fairfax County & Northern Virginia

A Quick Primer In Google Analytics – Understanding Your Data
 As we discussed last week, it is critical to not only track your website statistics, but also put that data to use. One of the most popular website analytics packages available is called Google Analytics.
Google Analytics can tell you which pages are most popular, how people get to your site, how many pages they view on your site before leaving, how long they stay on the site, and much more. This data helps you develop a picture of your visitors and helps you see where your site is doing well and where it needs improvement. Once you have this picture, you can then refine your action plan for improving your site.
It is important to remember that every business, and every website is unique. So, what metrics are important to focus on (and even what those metrics tell you) for one website may be different for another.
This week, we’ll give you a quick primer in Google Analytics terminology to help you understand the data. We won’t go into the nitty gritty detail, but our goal is to give you a basic understanding to help you make sense of what you are looking at.
Google Analytics Overview
Google Analytics works by placing a small piece of JavaScript on each of the pages of your website. JavaScript is a programming language common on the web. Google Analytics does not rely on your website logfiles from your web server, but tracks the data in its own database.
When a person visits your site, it uses that JavaScript to send back some statistics to the Google Analytics database. It does not track who you are, but it does track information about your browser, what type of device you are using, what site you came from, the country and city you are in, etc.
Google Analytics requires the browser to have JavaScript enabled, which is the case for the overwhelming number of visitors. But this also means that anyone who does not have Javascript enabled (typically a very small number) will not be included in the statistics. Also, most “robots” or “spiders” do not enable JavaScript and won’t be included in your data. “Robots” and “spiders” are computer programs from search engines and other sources that visit your site to index it, etc. So, you will likely see variations in the Google Analytics reports compared to other tracking methodologies.

Key terms
Hits – Be Careful of This Term
This term actually is not used within Google, but I’m including it here because it is a common but often misunderstood term.
Often times you may see a “hit counter” on a page. In this context, it is recording the number of times that page has been visited. However, technically speaking, an individual hit is each file sent to the web browser. A web page is generally made up of numerous files. It will have the main “html” file, plus it will typically have several image files, one or more “css” files, and often other files such as “JavaScript” files, etc. For a single page request, the website log could record 10, 20, or more “hits.”
So, it is important to remember when viewing reports based on website “log analysis” - such as from your hosting provider - the website logs typically record a “hit” as each file that was requested.
Visits – How Many Times Have Your Visitors Visited Your Site?
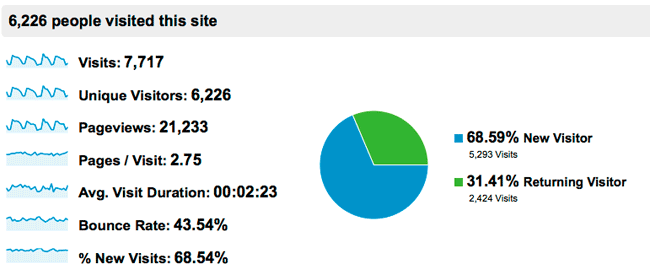
Visits are the number of sessions that have happened on your website in a particular time period. A visit occurs each time a person views one or more pages on your site. If the same person comes back again, that is another visit. It combines both new and returning visitors to your site.
More visits basically mean more traffic. This is generally a good number to be increasing.
Unique Visitors – How Many People Have Visited Your Site?
Unique visitors define how many people have visited your site. If a person views your site and then comes back later and views it again, that is 1 unique visitor but 2 visits.
This number is also a good number to be growing. However, if it represents almost all of your traffic, then this tells you that you are not getting any “repeat” business.
Pageviews – How Many Pages Have Your Visitors Viewed?
A pageview is simply the number of times that a page has been viewed. If a visitor views a page, goes to a second page, and then comes back to the first page, that is 3 pageviews.
This again is generally a good number to be increasing. Just understand the limitations.
Unique Pageviews – How Many Pages Have Your Visitors Viewed At Least Once?
This is similar to a pageview, but it only records the first time the page was viewed in a particular session (or visit). If a visitor views a page, goes to a second page, and then comes back to the first page, that is only 2 unique pageviews.
Pages / Visit – How Many Pages Do Your Visitors Look At On Average?
This metric is the ratio of the average number of pages viewed per visit. This helps you see how involved your visitors are in your site. If this is a low number, your visitors may not be finding your content useful and may only look at a page or two and then leave.
Average Visit Duration – How Long To Your Visitors Stay On Your Site?
This metric tells you how long your visitors stay on your site on average. So, if a visitor spent 2 minutes on page 1, 3 minutes on page 2, 2 minutes on page 3, viewed page 4 and left, that would be a visit duration of 7 minutes (2 + 3 + 2). The main limitation for this metric is that there is no way to tell how long the visitor stays on the last page before leaving your site. So, in this example, the duration would not include the time spent on page 4.
Bounce rate – Do Your Visitors Like Your Site?
A bounce is where a visitor comes to your site, views a single page, and then leaves. The bounce rate is the percentage of visitors that “bounce” or just visit that single page and leave.
This is a powerful metric and you want it as low as possible, unless all of your visitors immediately pick up the phone and call you on the first page they see from your site, which is unlikely. You can look at bounce rates by traffic source, by landing page, etc.
A high bounce rate can indicate that you have a problem. For instance, it could indicate that your site is slow to download and people are too impatient to wait. Or it might mean that your content is not engaging and does not draw them in, or you need to experiment with your calls-to-action to draw them into your site. Bounce rate is a powerful metric and one to keep your eye on.
% New Visits – What Percentage Of Your Visitors Are First Time Visitors?
This metric tells you what percentage of visitors to your site are there for the first time. If this number is really high, then it means that you are not getting much repeat traffic. You may want to look at some strategies to get your visitors coming back.
Traffic Source – Where Did Your Visitors Come From?
This is a report that tracks where your visitors came from. It will generally be:
- Direct: the visitor either typed your URL in directly to the browser or had your website bookmarked.
- Referrals: this visitor clicked a link on another site to get to your site.
- Search: the visitor found you in a search engine.
- Campaign: this is one that you can define by providing extra information in the links you create to your website. It may be used to track pay per click advertising, RSS feed traffic, links in email Newsletters, etc.
Your traffic sources are an important area to monitor. It helps you understand where your strategy in a particular area is doing well and where you need more work.
Landing page – Which Page Did Your Visitor First Visit?
The landing page is the page where your visitor enters your website. Typically, when visitors come to your website through a search engine or a campaign, they will enter your site on one of your sub pages and not on your home page.
By monitoring your top landing pages, you will be able to focus your attention on improving these pages as well as get a better understanding of what type of content is drawing the most interest, etc.
Conclusion
We’ve given an overview of what Google Analytics is and helped you understand some of the key terminology used in the reporting. Don’t forget. It is not just enough to look at the data and put the report away. Use it to develop actionable strategies to help propel your website forward.
Stay tuned for our next article as we conclude our SEO series and discuss Social Media’s impact on search engine optimization.
